

Arterial Occlusion CFD Simulation, ANSYS Fluent Tutorial
Price: $8
- The problem numerically simulates arterial occlusion considering blood using ANSYS Fluent software.
- We design the 2-D model by the Design Modeler software.
- We Mesh the model by ANSYS Meshing software.
- The mesh type is Structured, and the element number equals 85222.
- We define a curve line function to draw the stenosis of the vessel branch.
Arterial Occlusion CFD Simulation, ANSYS Fluent Tutorial
Price: $8
- The problem numerically simulates arterial occlusion considering blood using ANSYS Fluent software.
- We design the 2-D model by the Design Modeler software.
- We Mesh the model by ANSYS Meshing software.
- The mesh type is Structured, and the element number equals 85222.
- We define a curve line function to draw the stenosis of the vessel branch.
Description
This problem simulates arterial occlusion considering blood by ANSYS Fluent software. We perform this CFD project and investigate it by CFD analysis.
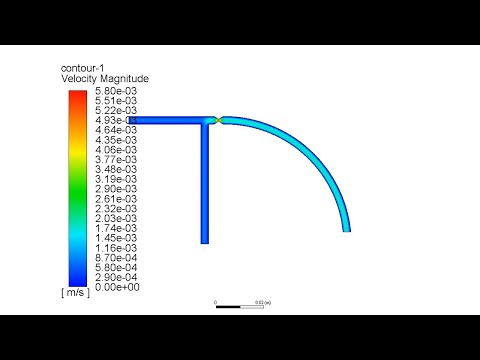
In this project, a vessel with two branches is modeled. The fluid used in the simulation process is blood, which has a density of 1060 kg/m3 and a viscosity of 0.35 kg/m.s. There is a stenosis in the middle of the vessel. A curvature line function has been used to define and plot the vessel's stenosis.
This simulation aims to investigate the behavior of the blood passing through this stenosis. The mass flow rate of the blood flow to the artery from both inlet branches is 0.002385 kg/s, and the vessel wall is assumed to be static.
The geometry of this project is designed in the ANSYS design modeler and is meshed in ANSYS meshing. The mesh type is structured, and the element number is 85222.
Arterial Method
For the geometry of the vessel, a curve line function was used to plot the stenosis of the vessel branch. This function represents the sum of the points x and y that make up a curvature line obtained from the relation ‘‘y=0.0002475cos((πx)/0.001)’’.
For example, the curve is assumed to be 30% of the vessel’s congestion; This means that the ratio of the diameter of the vessel in the area with clogging to the diameter of the vessel is 0.7.
Percentage of clogging in the vessel changes to compare the behavior of the fluid in different states. The changes in the percentage of clogged arteries are 30%, 40%, 50%, 60%, 70%, 80% and 90%, respectively.
Arterial Conclusion
After simulation, 2D contours of pressure and velocity, as well as 2D pathlines and vectors, are obtained. The velocity contour indicates that the maximum velocity value occurs exactly at the stenosis point; Because the cross-section of the fluid reaches a minimum.
The pressure contour shows that the pressure of the fluid decreases after passing through the stenosis and its value is less than the pressure at the inlet of the two branches.
Also, the plots of pressure, velocity, and pressure drop according to the percentage of clogged arteries are presented. According to the plots, as the percentage of clogged arteries increases, the pressure drop of blood increases, and the velocity of blood passing through the clogged area also increases. This is because the high percentage of clogging indicates more obstruction of the vessel path.