
Drone CFD Analysis in Low and High Altitudes, ANSYS Fluent Simulation Training
Price: $219
In this study, the effect of different altitudes of a high-speed drone has been studied using ANSYS Fluent software.
Drone CFD Analysis in Low and High Altitudes, ANSYS Fluent Simulation Training
Price: $219
In this study, the effect of different altitudes of a high-speed drone has been studied using ANSYS Fluent software.
Project Description
In this study, the effect of different altitudes of a high-speed drone has been studied using ANSYS Fluent software. The fluid is air, and we considered it as a compressible ideal gas. The maximum speed of the drone is 30 m/s, and the investigated altitudes are 20m and 2000m as low and high altitudes, respectively.
Assumption:
The assumptions that we used in this study are listed below:
- Steady-state
- The flow is turbulence
- Compressible ideal gas
- All zones around the drone are symmetry
- Density-Based solver
Drone Geometry & Mesh
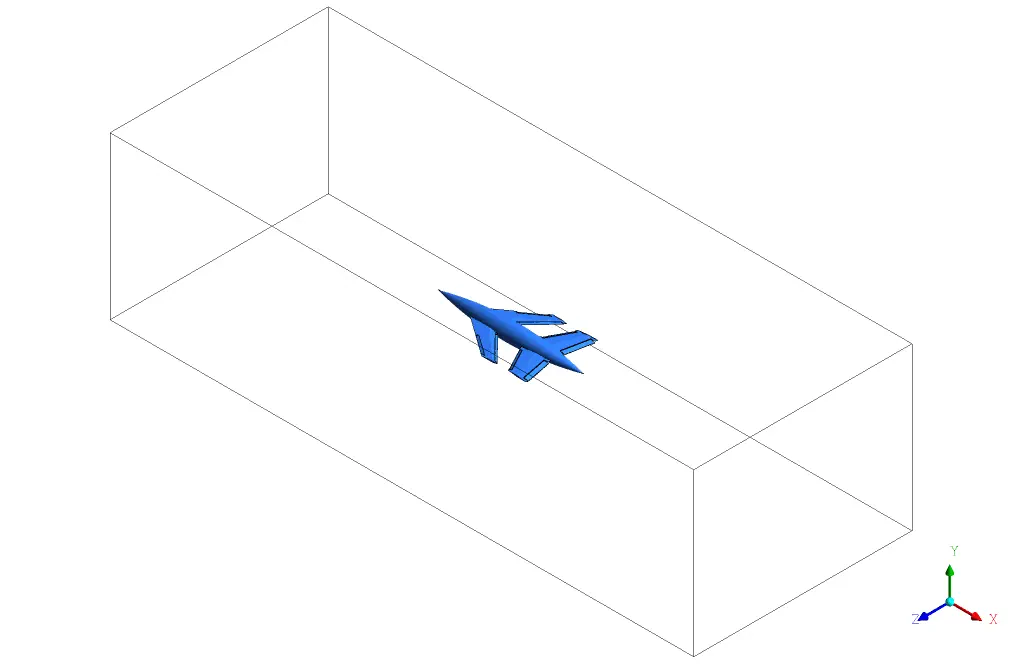
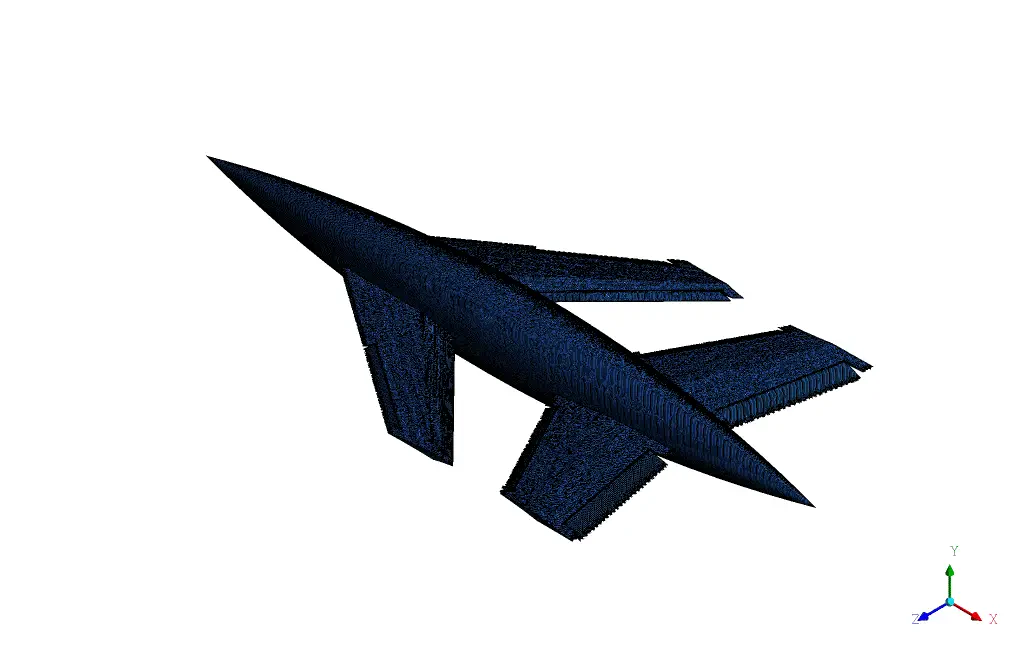
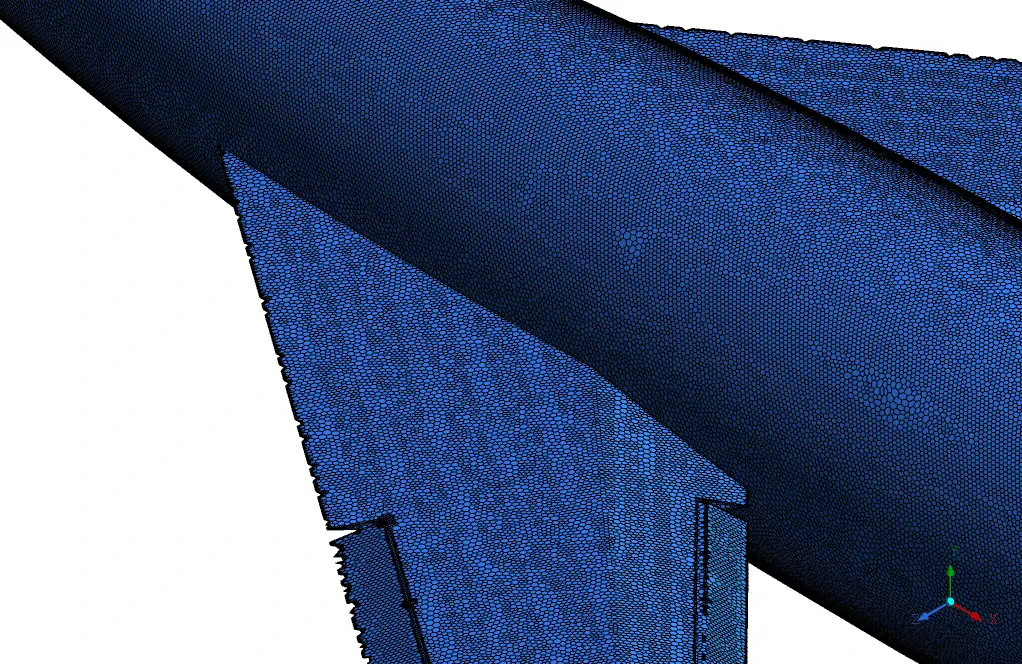
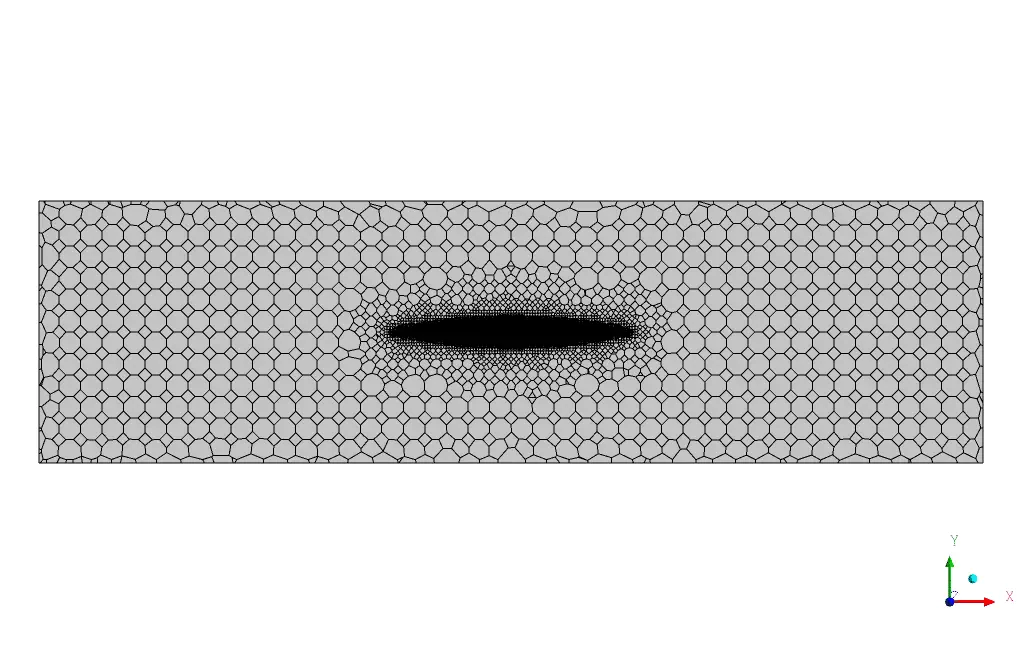
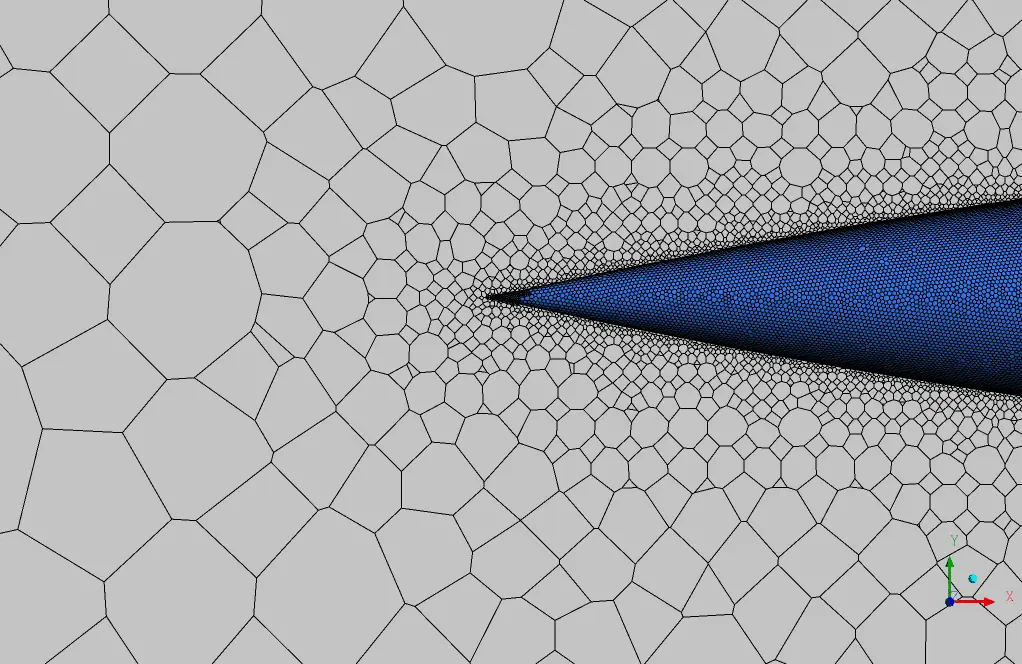
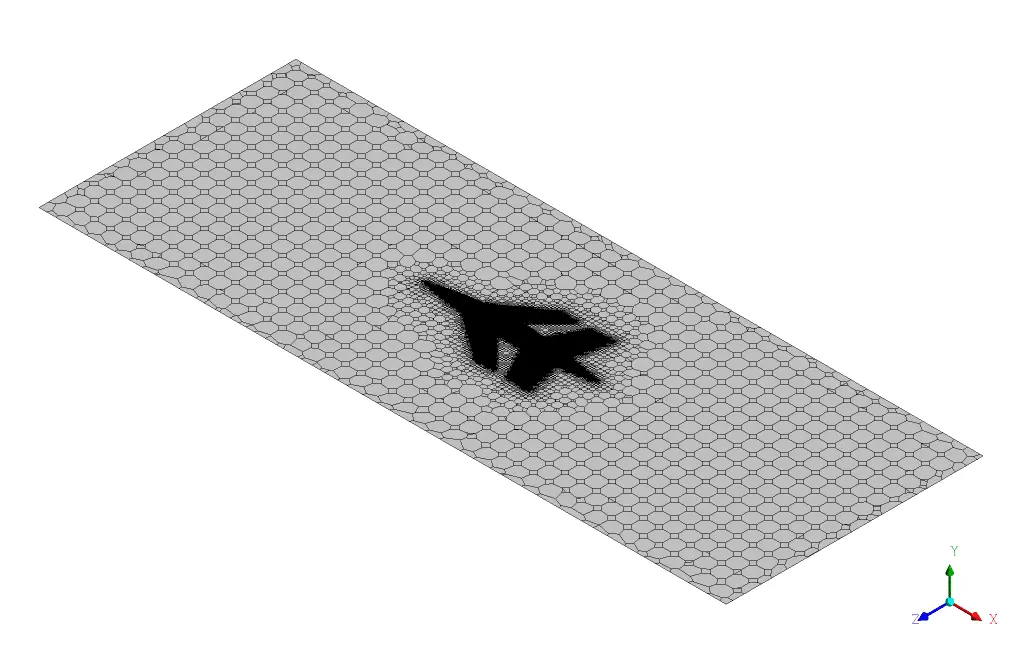
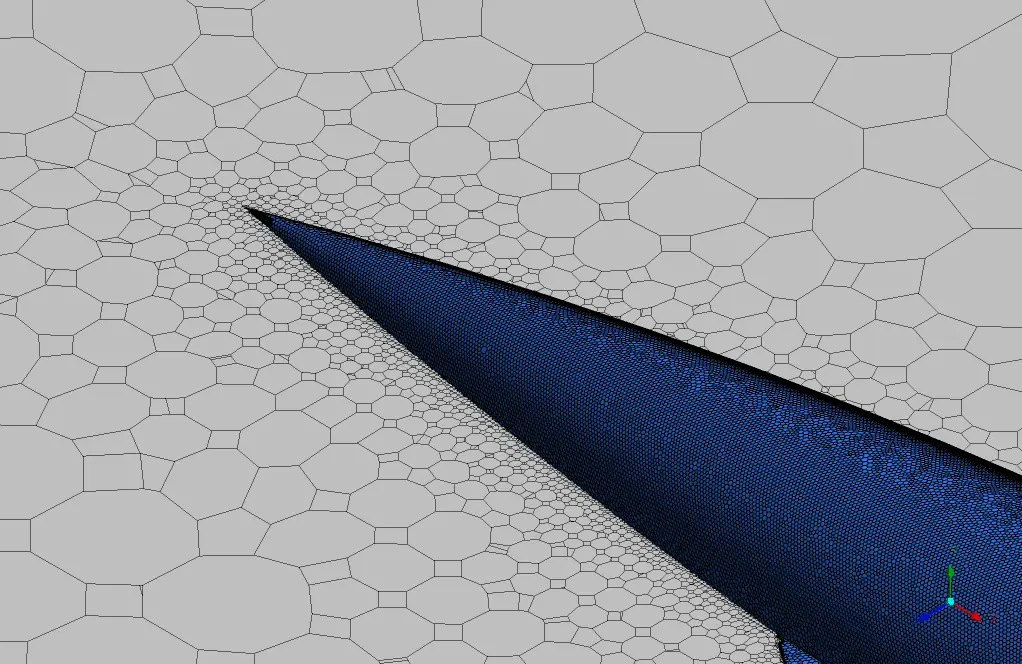
The Spaceclaim software fixed the geometry. The mesh was generated using the octree method by ANSYS Meshing software, and the Delaunay method has been used to improve the quality of the existing mesh. Finally, to prevent a high aspect ratio and low skewness, the mesh was converted from tetrahedron to polyhedral, decreasing the number of elements. The final number of mesh is about 12000000 cells.
Drone Model Setup
Table 1 shows all the settings which is used in this study.
Table 1. Model setup and boundary conditions
| General Settings | |
| Gravity | |
| Solver type | Density Based |
| Time | Steady |
| Models | |
| Viscous | Inviscid |
| Viscosity | Constant (Air) |
| Density | Ideal gas |
| Boundary Conditions | |
| Inlet | 30 m/s |
| Outlet | Pressure Outlet |
| Wall | Symmetry BC |
| Solution Methods | |
| Coupling of Pressure-Velocity | SIMPLE |
| Spatial Discretization | 2nd order for Pressure and Momentum |
Results
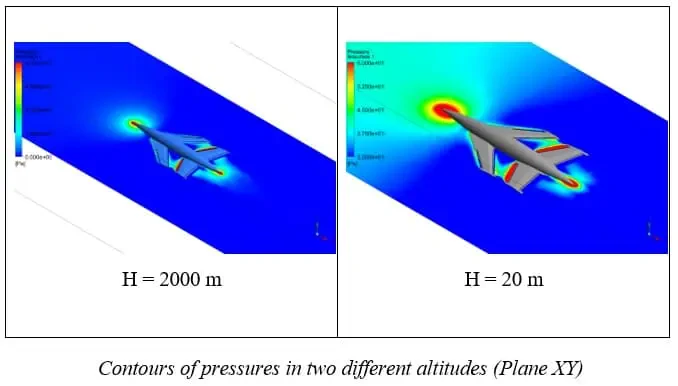
The following figures illustrate pressure distribution around the drone in two different altitudes. According to the contours, pressure in 2000 m is lower than 20 m. This is because at the altitude of 2000 m, the temperature is around 3℃, and the pressure is around 70,000 Pa less than the atmospheric pressure at 20m height. Therefore, the pressure will have a more impact on the drone at the lower altitude.
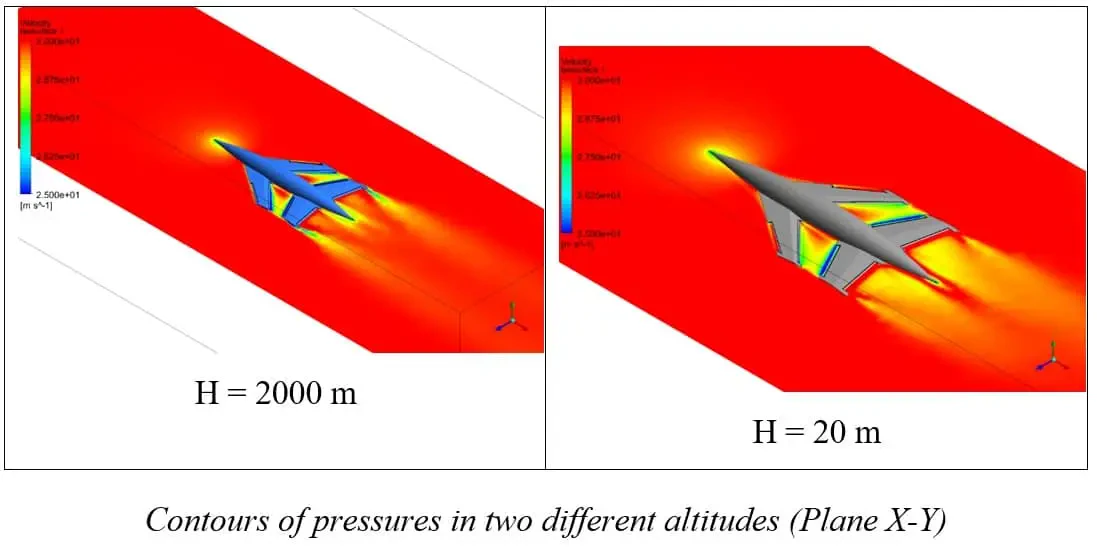
According to the velocity contours, the velocity is lower at the drone's back at the altitude of 20 m than the altitude of 2000 m.
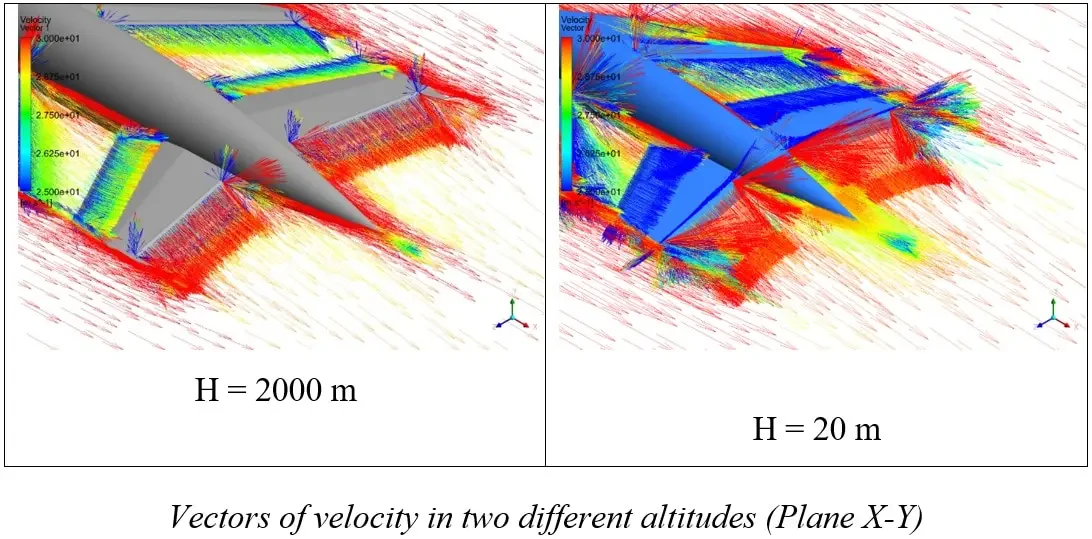
To see what is going on there, the following shows some vortex there, that can have some negative impact on the movement of the drone.
The drag coefficient at the altitude of 20 m and 2000 m are about 0.011868 and 0.00756, respectively. It means, at the low attitudes drag force is more than the higher altitudes.