

Ffowcs Williams & Hawkings (FW-H) Acoustic Model, ANSYS Fluent CFD Simulation Tutorial
Price: $20
- The current CFD Analysis simulates the flow around a cylinder to investigate its aeroacoustics condition.
- The simulation is dependent on time so is performed in transient form.
- The Ffwocs Williams & Hawkings Acoustic Model has been used for acoustic modeling.
Description
In this project, the airflow around a cylinder is simulated to investigate its acoustic condition using Ffwocs Williams & Hawkings (FW-H) model.
The two-dimensional geometry is designed in ANSYS Design Modeler software. Also, the structured grid is carried out using ANSYS Meshing meshing. As a result, 23264 elements were generated.
This product is the 2nd episode of the Acoustic Model Training Course.
Methodology of Ffwocs Williams & Hawkings Acoustic Model CFD Simulation
The simulation is Transient(unsteady) to capture fluid behavior over time. The Pressure-based solver type is used due to the incompressibility of the working fluid. Also, Fwocs Williams & Hawkings (FW-H) is employed.
Conclusion
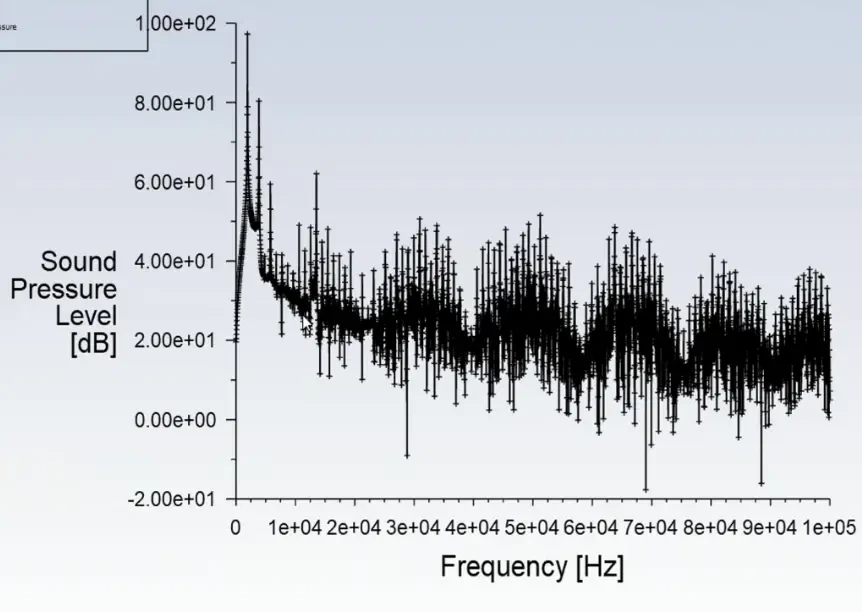
At the end of the simulation, the sound pressure level, A-weighted and acoustic pressure recorded by the defined receivers are extracted. The graph of acoustic pressure is extracted in terms of time. In the first step, the data has been taken to the frequency domain using Fourier transform. The acoustic signal information is plotted in decibels in the frequency domain in the graph you see in the results (sound pressure level plot). As it is clear from the graph, the most sound that is present by the microphone installed at the receiver location occurred in a frequency range smaller than 2e+4.
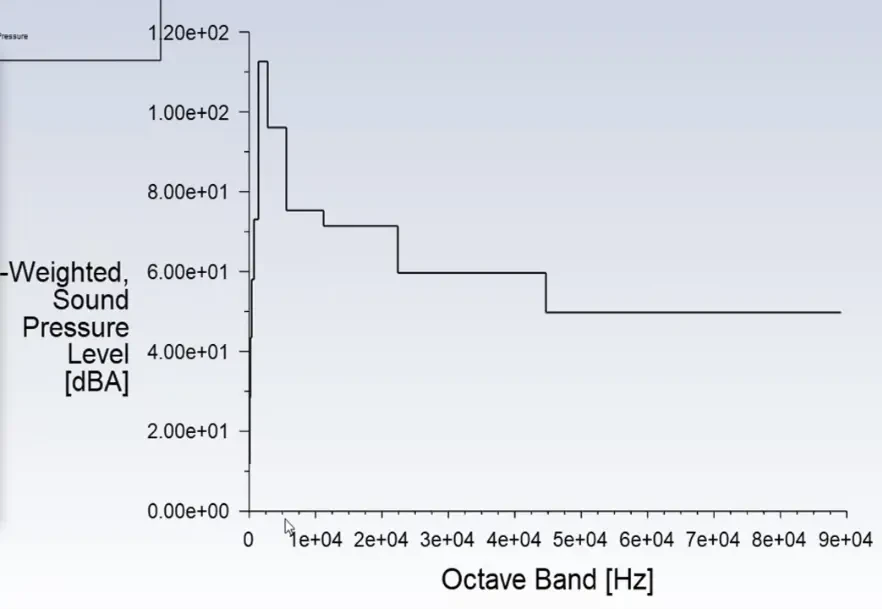
A-weighting is an established, standard curve that attempts to alter the sound pressure levels recorded by a microphone measurement to more closely match the perception of the human ear. This graph also confirms the previous results, and as it is known, the highest frequency that the human ear can hear at the location of the desired receiver happened at frequencies smaller than 1e+4.
Data is dedicated to recording the nearer and farthest receivers and clearly shows how the acoustic pressure level decreases by getting farther from the acoustic source (cylinder).