

ICU Ventilation Design Improvement, Industrial Application
Price: $120
- The geometry is designed in Design Modeler & meshed in ANSYS Meshing software.
- One of the patients suffering from respiratory disease. It is one of our goals to prevent it from dispersion.
- The one-way discrete Phase Model (DPM) is used to model aerosols.
- An acceptable thermal comfort is our other concern in this project which is controlled by PPD & PMV factors.
ICU Ventilation Design Improvement, Industrial Application
Price: $120
- The geometry is designed in Design Modeler & meshed in ANSYS Meshing software.
- One of the patients suffering from respiratory disease. It is one of our goals to prevent it from dispersion.
- The one-way discrete Phase Model (DPM) is used to model aerosols.
- An acceptable thermal comfort is our other concern in this project which is controlled by PPD & PMV factors.
ICU Design Improvement Considering Preventing Respiratory Disease Transmission & Thermal Comfort
Introduction:
Almost all infectious respiratory diseases are spread from person to person, which means that anyone in a school, workplace, community, etc can contract one.In the ICU room, the situation of breathing diseases is strongly crucial and may result in hard physical damage.This is why we seek a smart design to prevent any transmission while providing the best HVAC (thermal comfort) conditions.
This product is the 6th chapter of the DPM training course.
Project Description:
In this project, we set the target to design an ICU considering thermal comfort conditions including PMV & PPD. Also, It is important to prevent the transmission of infectious diseases. In the project, one patient called patient #1 is suffering from a respiratory disease which puts an infection scenario in more attention.
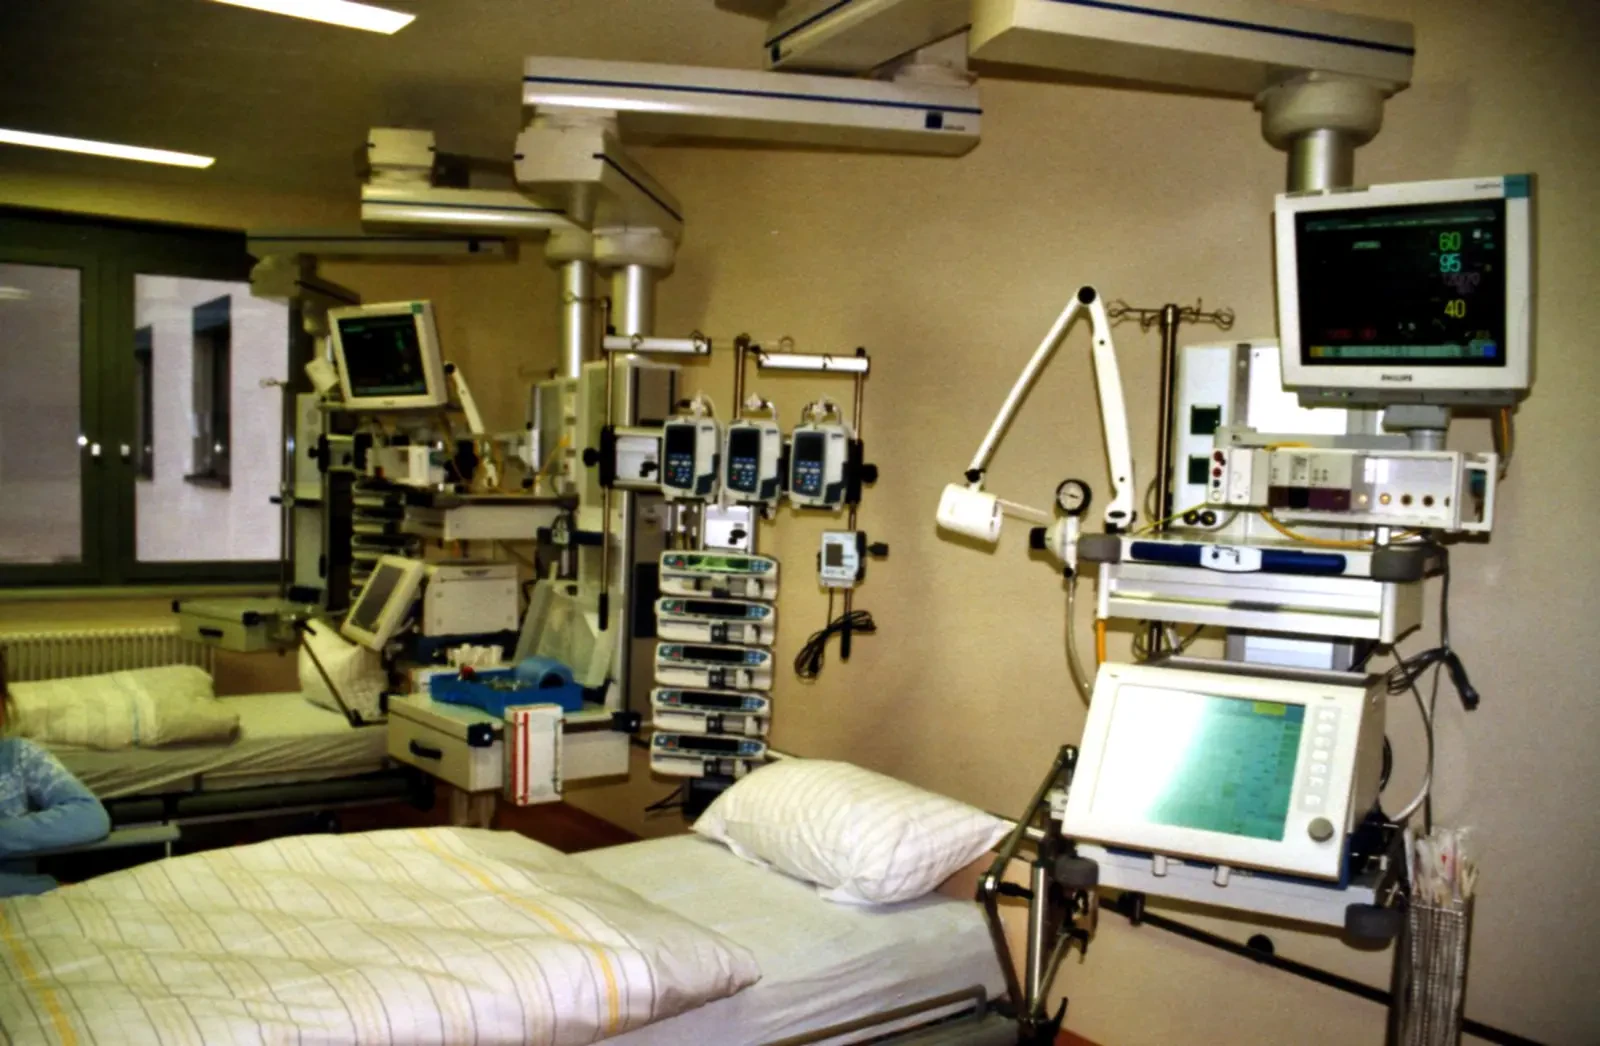
Figure 1- ICU of a hospital
We aim to keep mentioned parameters within the acceptable range shown in the table:

In the following, the design of the ICU will be explained in detail.
- Step 1: (Widely used HVAC system)
In the first step, the ICU is simulated with its initial condition considering the widely used HVAC systems which assume inlets and outlets on opposite walls(check Figure below). The inlet velocity is 0.58m/s and 294K temperature while virus aerosols are injected with patient 1 breath.
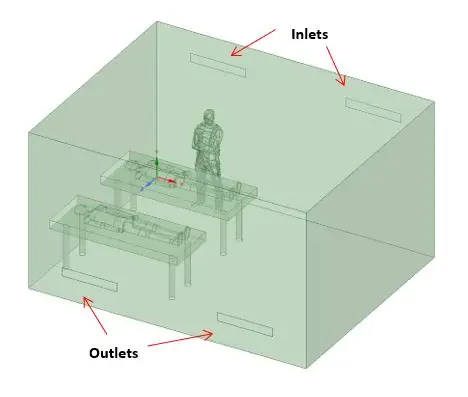
Figure 2- Design 1 geometry
The results of the simulation show how the designed HVAC system could provide acceptable PMV but not PPD. As depicted in figure 3, the PMV contours around the doctor and the patients within the -0.7 to 1 range prove the claim.
Moreover, figure 4 illustrates the PPD in the range of 5% to 20%, and obviously, it is not satisfying for an ICU room thermal comfort.
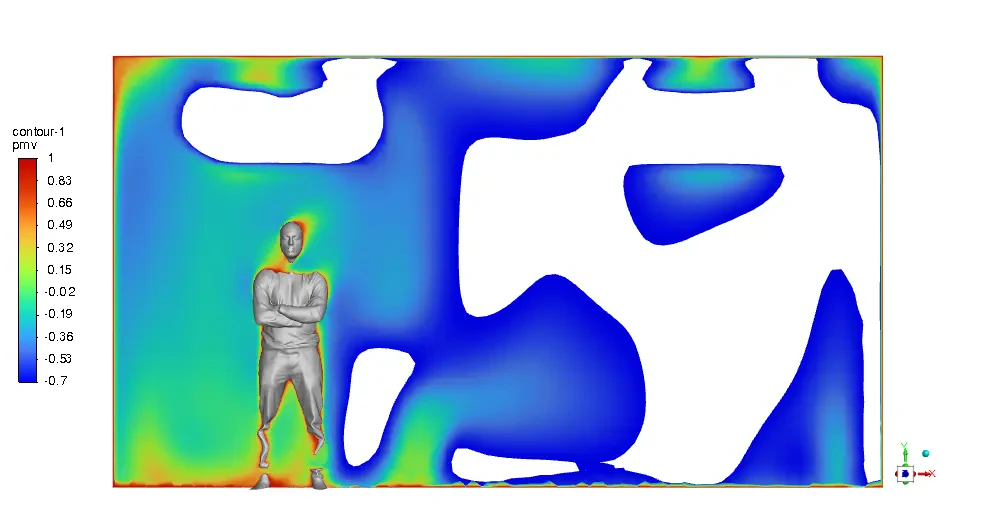
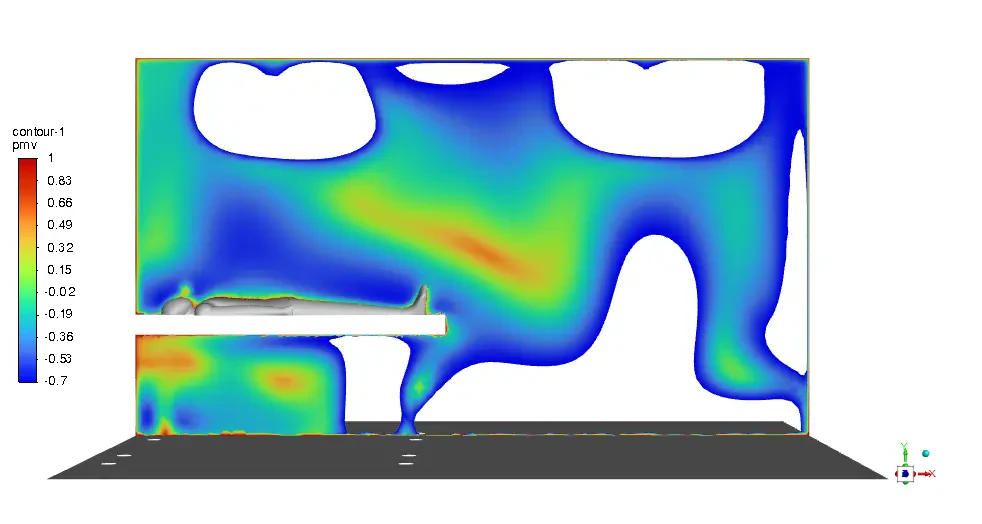
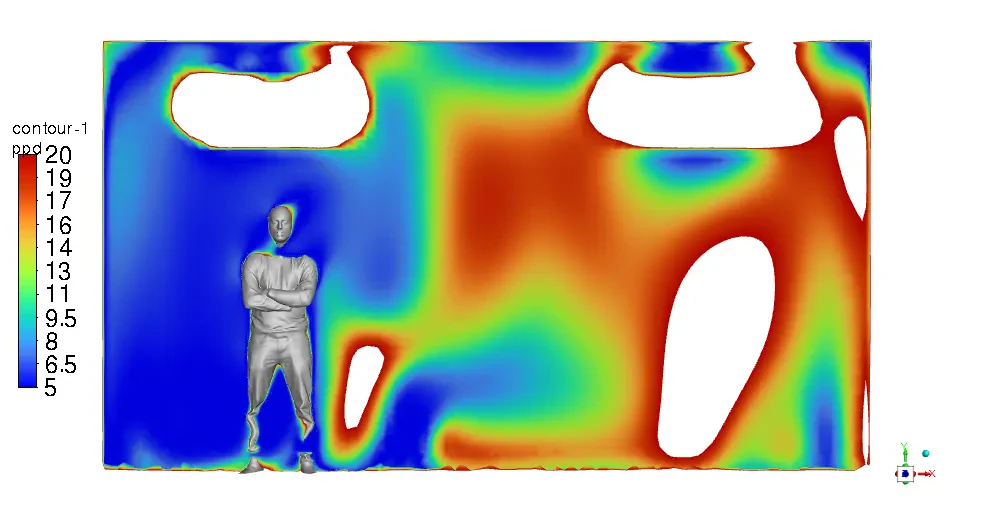
Figure 3- PMV contour a) around the doctor b) around patient #1 c) around patient #2
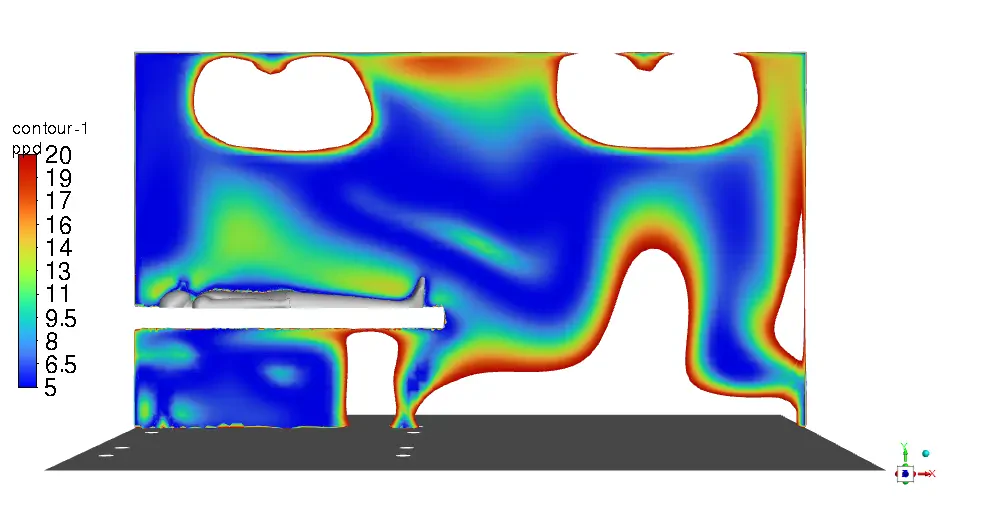
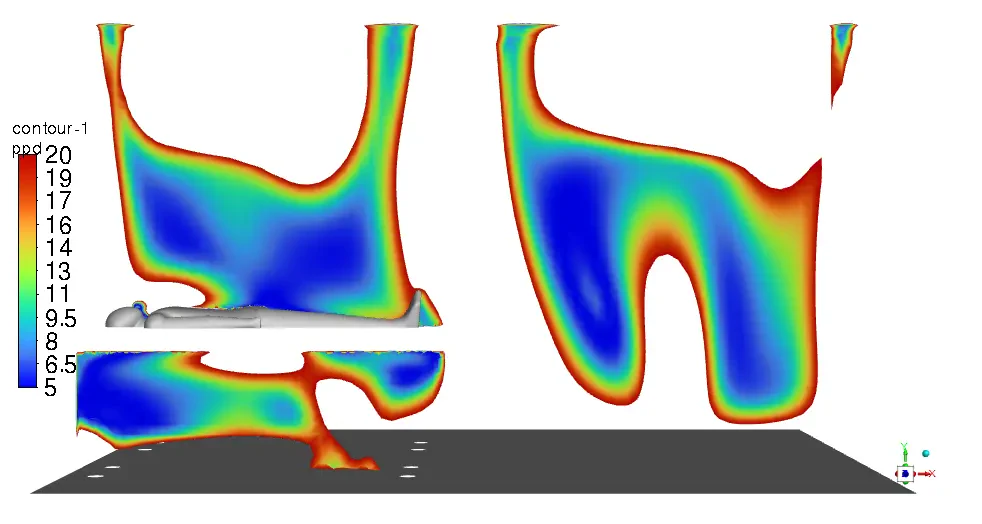
Figure 4- PPD contour a) around the doctor b) around patient #1 c) around patient #2
On the other hand, it lasts about 7 minutes for the virus particles to escape the room completely which is not satisfying at all! (figure 5) It is highly probable to be spread to the doctor and the other patient.
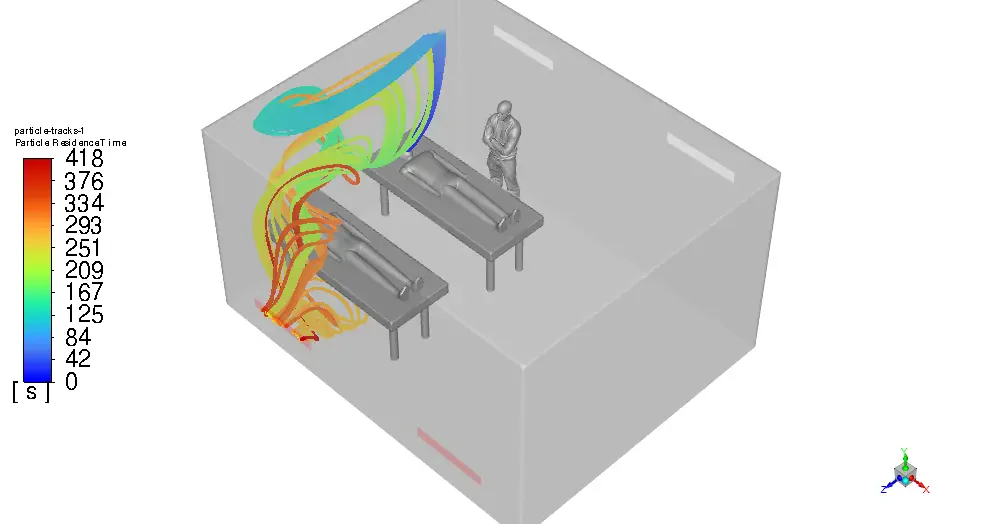
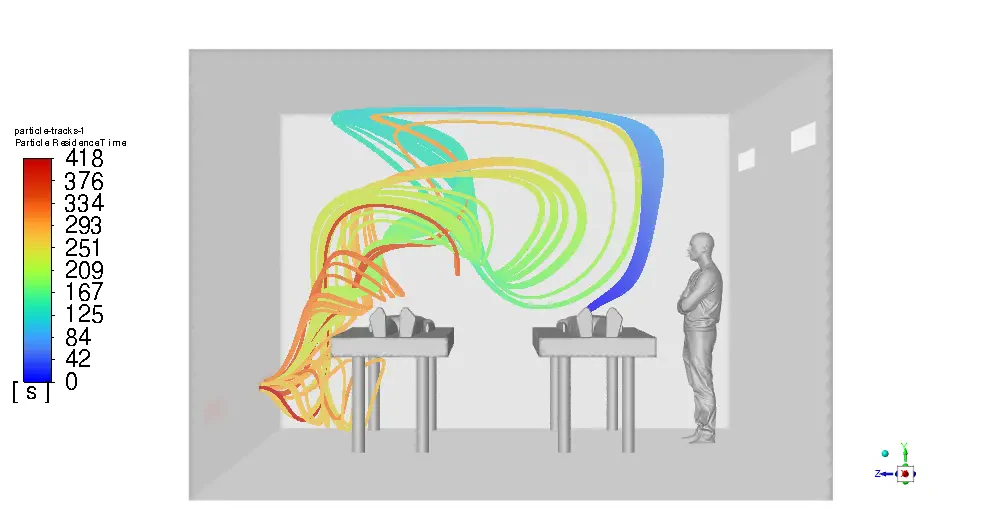
Figure 5- Virus Particles Residence Time a) Isometric view b) Front view

- Step 2: (Using Cross Ventilation)
In the second step, the outlets are proposed to be installed above the head of the patients but keep the inlets where they were.
We predict to decrease in the virus particle`s residence time by cutting its distance to the outlets short. Design 2 is modeled and shown below:
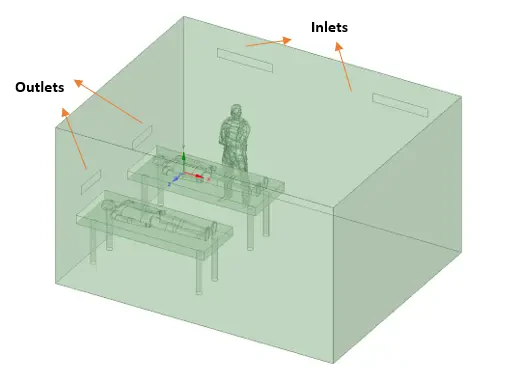
Figure 6- Design 2 geometry
Just like the previous step, first of all, we need to check the thermal condition. As illustrated in Figures 7 & 8, the PMV and PPD with values in the acceptable range are hardly visible and most of the room is not in an appropriate thermal condition.
Therefore, Although we expected to reduce the particles' residence time (which will be determined in the following), the thermal comfort condition became poor in contrast with the previous design.
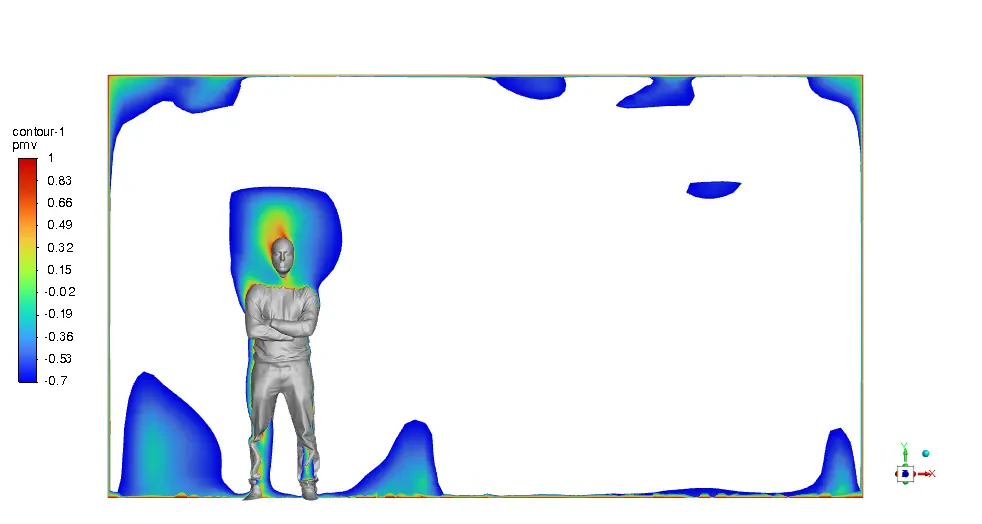
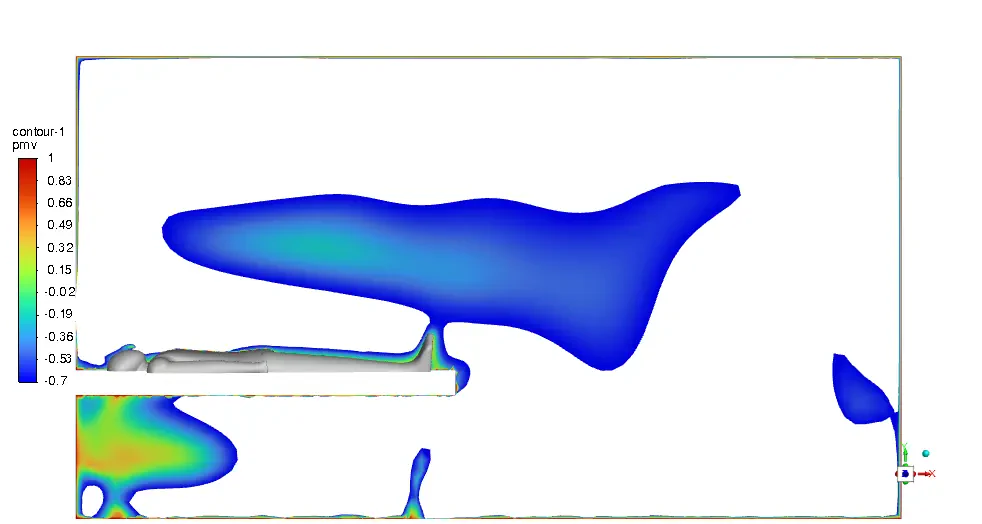
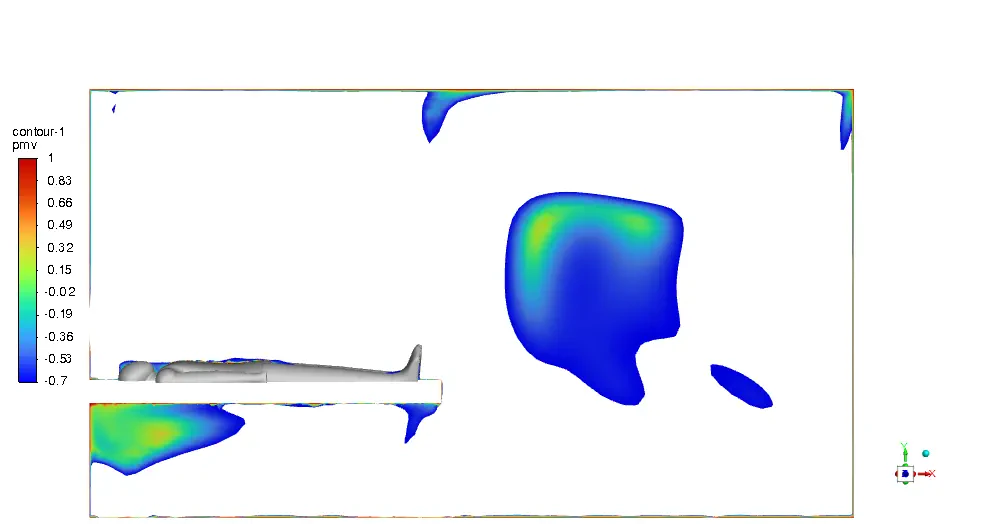
Figure 7- PMV contour a) around the doctor b) around patient #1 c) around patient #2
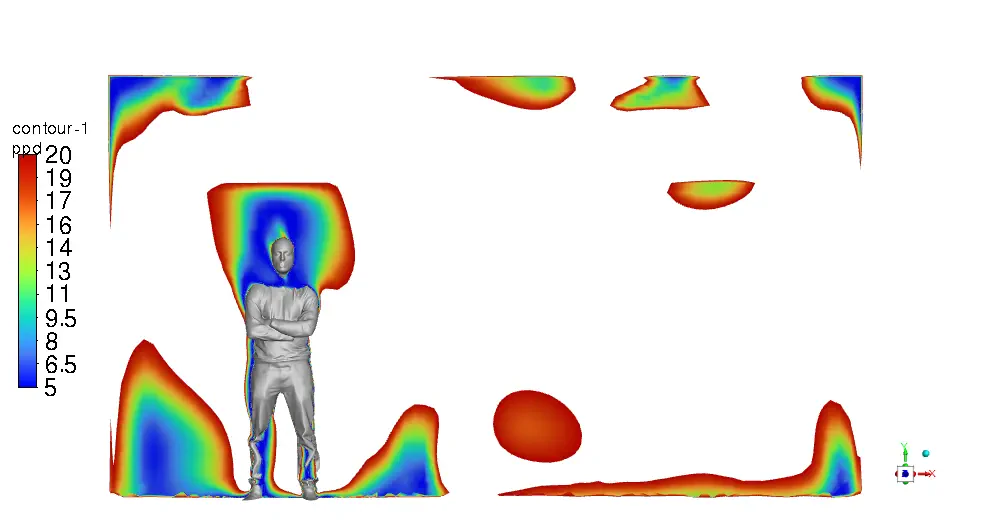
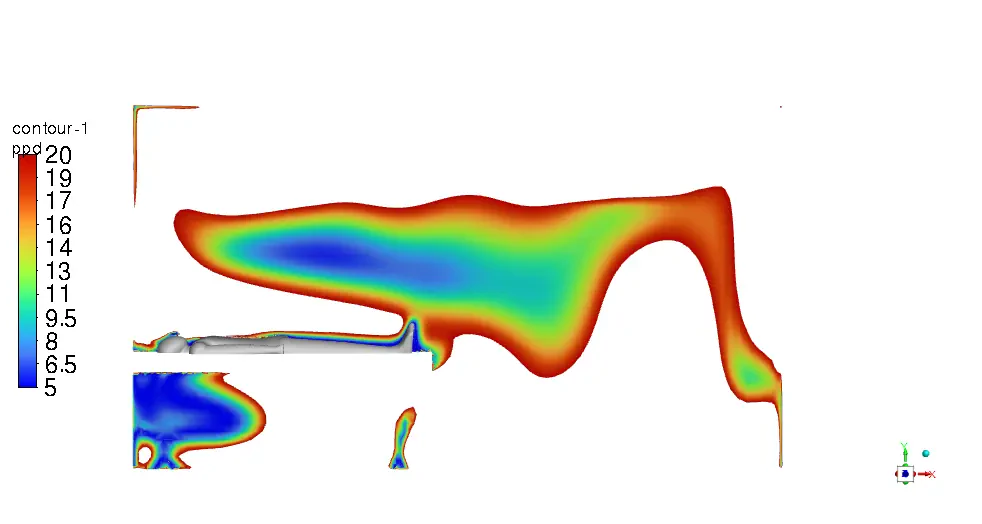
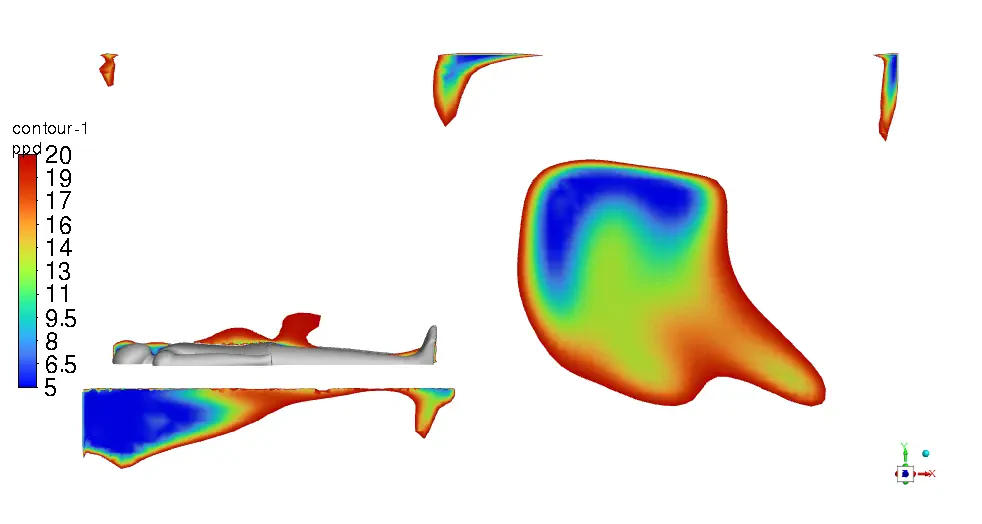
Figure 8- PPD contour a) around the doctor b) around patient #1 c) around patient #2
By the way, figure 9 proves that our theory and expectations of reducing aerosol particles' residence time have come true. It reaches just 4 seconds which is a big step in the designing process, still.
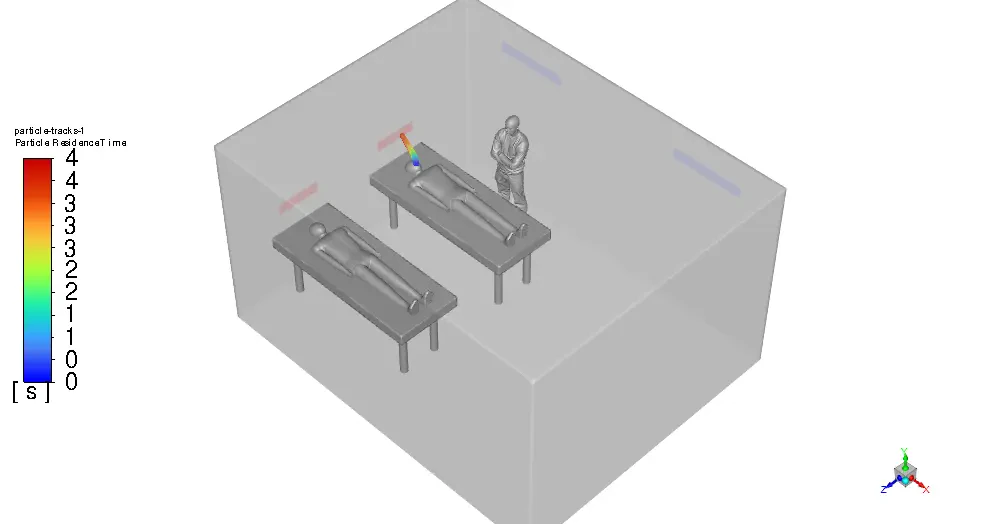
Figure 9- Virus Particles Residence time

- Step 3: (Revision to Design2)
The cross-ventilation design (design #2) has proved that by using outlet vents above the head of the patients, the risk of infection gets to nearly 0%!
for the patients suffering from respiratory disease. Hence, we came up with the idea of keeping the outlets but changing the inlet`s (supply) locations.
Also, a decrease in the velocity of inlet vents could be effective to provide the appropriate thermal condition. This is called Design #3 shown below:
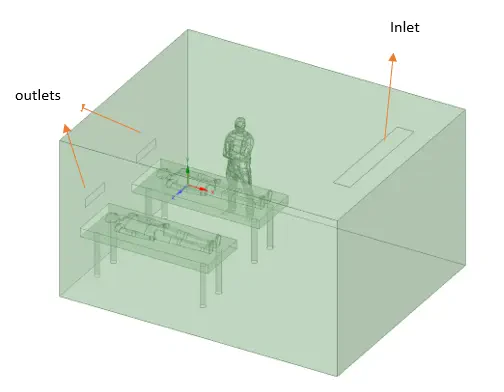
Figure 10- Design 3 geometry
Instead of using two 150*300mm, a single 300*600 inlet vent is used on the ceiling, away from the beds. Also, the reduction in velocity of the inlet is employed (0.15m/s).
The PMV & PPD contours show that this design can be very promising and we can be assured of thermal comfort in the ICU room. Most of the critical regions in the room are in an acceptable range. You can check them below in Figures 11 & 12.
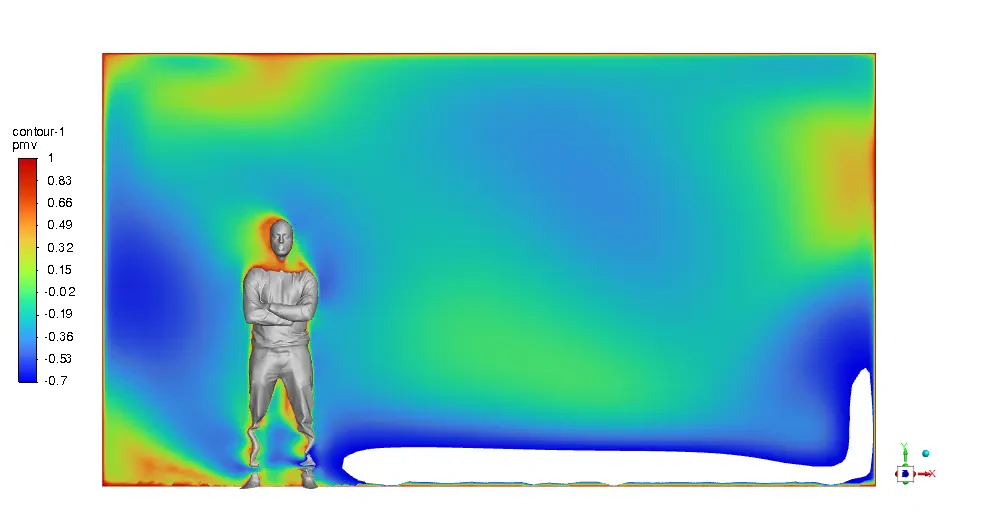
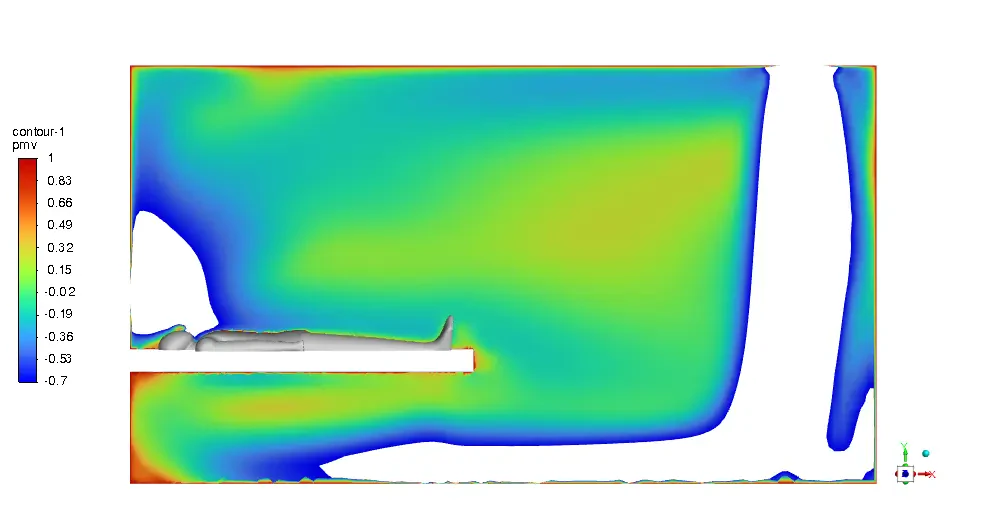
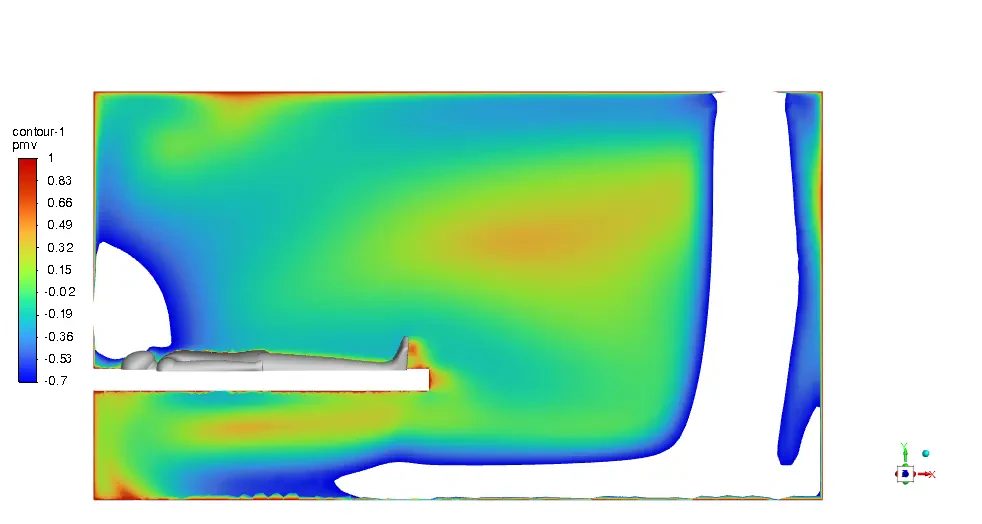
Figure 11- PMV contour a) around the doctor b) around patient #1 c) around patient #2
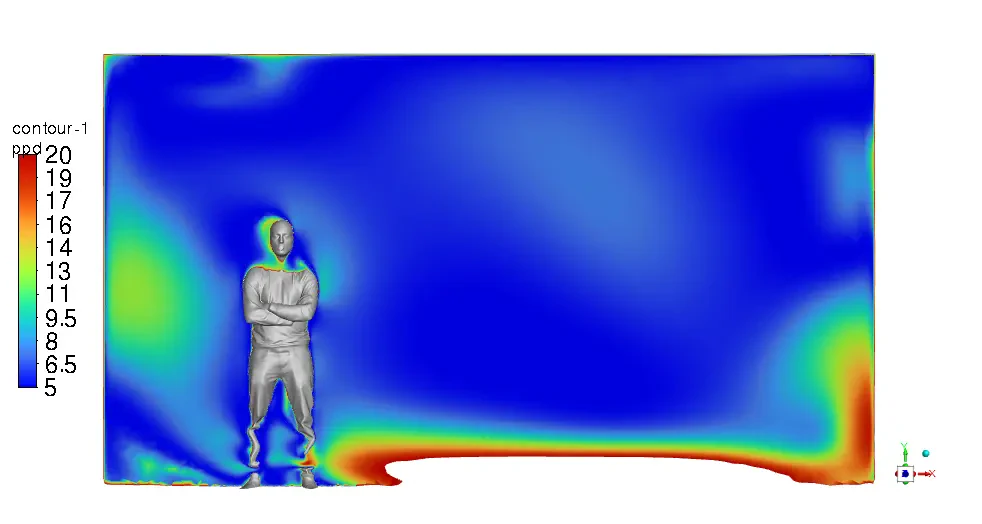
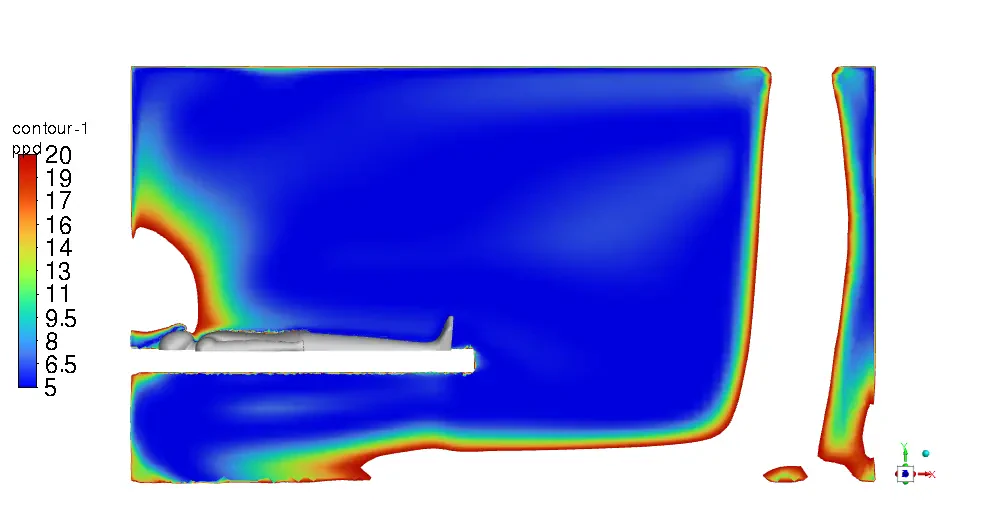
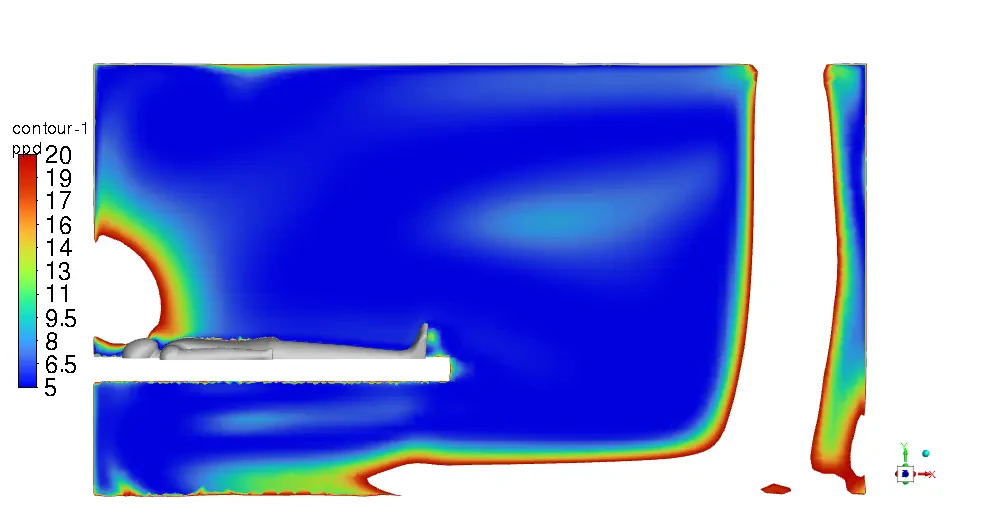
Figure 12- PPD contour a) around the doctor b) around patient #1 c) around patient #2
From another aspect, the aerosol particle's residence time increases up to 9 seconds in contrast with Design 2 which was 4s. Although it gets doubled, still is effective and can prevent any dispersion.
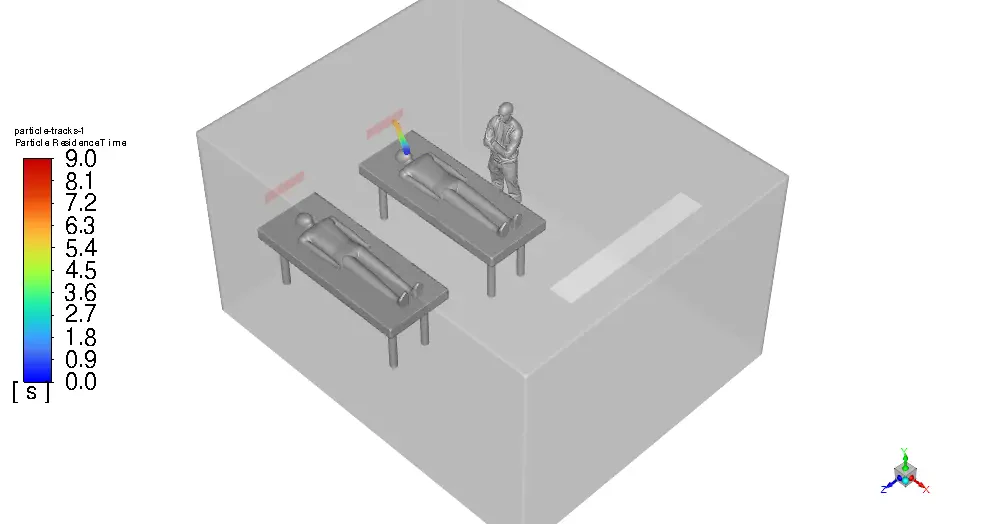
Figure 13- Virus Particles Residence time
So we can sum up the results in the table below:
